The Weekly Activity Report provides a quick glimpse of the Inspire-related activity occurring across your entire organization for the week. It is a great tool to help you see overall adoption, usage, and trends across your company.
The Weekly Activity Report provides you with two quick views to gain high level insight into what is happening across your organization with Inspire-related user activity. You can change parameters in the report to view past activity, too.
This article covers the following topics:
What you can do with the report
Opening the Report
1. On the top toolbar, click the Modules ![]() menu and select Reports.
menu and select Reports.
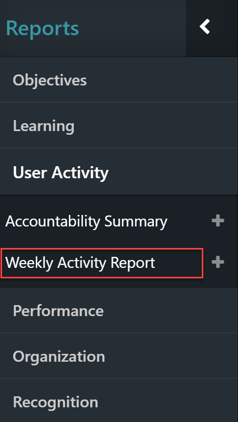
2. On the left side of the Reports page under the Reports  section, click User Activity to expand the list of available reports.
NOTE: Depending on the permissions of your account as provisioned by your Inspire Administrator, this report may appear under User Activity or under Accountability.
3. Click on Weekly Activity Report; the Weekly Activity Report page opens.
NOTE: You can click the Add ![]() icon on the right side of the report title to pin the report to the Quicklinks section on your homepage.
icon on the right side of the report title to pin the report to the Quicklinks section on your homepage.
Reading the Report
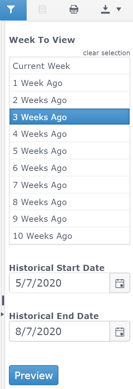
At a glance:
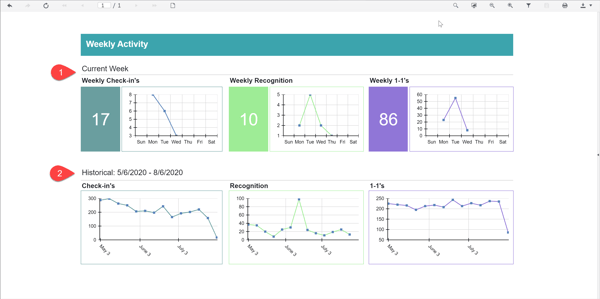
(1) Current Week shows you a graphical representation for three categories of activities:
- Weekly Check-in's,
- Weekly Recognition,
- Weekly 1-1's.
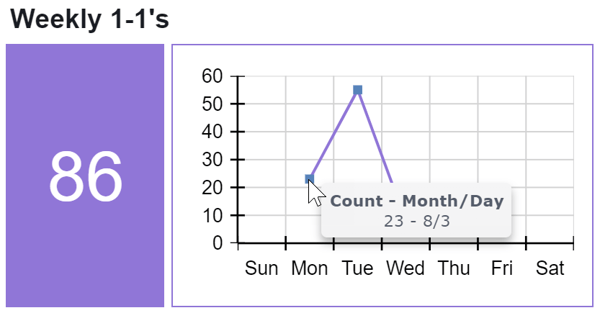
- Each large colored block displays the total number for that category for the week-to-date.
- The x-axis represents the number of items in the category and the y-axis represents the day of the week.
-
- Hover over a data point to see the actual count and date for a specific day of the week.
- Hover over a data point to see the actual count and date for a specific day of the week.
NOTE: The report week starts on Sunday and ends on Saturday. If the report is opened mid-week, the total number is current from Sunday through the time the report is opened.
For example, if you open the report on Thursday the total number in the block includes only Sunday through the current time on Thursday.
(2) Historical shows you a high level graphical overview of the three categories over three months.
- The three month period displayed is adjacent to the Historical title.
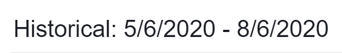
- The x-axis represents the number of items in the category and the y-axis represents the day of the week.
- Hover over a data point to see the actual count and date for the specific point of time in the three month span of time.
- The reporting week starts on Sunday and ends on Saturday. The date given is the Sunday for the week of the date displayed. The count is for all occurrences within that week.
- For example, in the 1-1's figure below there were a total of 213 1-1's counted for the week of 6/28. Any 1-1 which occurred between Sunday, 6/28, thru Saturday, 7/4, is included in the count.
Working with the Report
Use the Toolbar Icons
Report Toolbar:

Use the toolbar icons to refresh the page view, move through pages if it is a multi-page report, toggle the print view on or off, use search to find something specific on the report page, toggle between the full page and page width view, zoom in or out on the report, use parameters to look at the report from a different perspective, print the report, a or export the report.
Identify and locate the toolbar icon:
| Refresh page view ![]() | Page number selector _ of X
| Page number selector _ of X  | Toggle Print Preview
 ![]() |
|
| Toggle Search ![]() | Toggle Full Page/Page Width
| Toggle Full Page/Page Width ![]() | Zoom Out
| Zoom Out ![]() | Zoom In
| Zoom In ![]() |
|
| Filter - Toggle Parameters Area ![]() | Print
| Print ![]() | Export
| Export ![]()
What you can do with the report
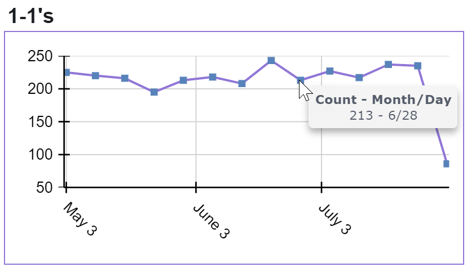
Using the Filter Parameters
Use the filter parameters to look back at past activity for the three categories.
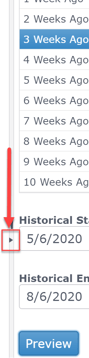
1. Click the filter ![]() icon. The parameter panel opens.
icon. The parameter panel opens.
2. Click on 3 Weeks Ago. You can also use filter parameters to:
-
- Click on one of the other options on the Week to View list, i.e. 6 Weeks Ago, or
- Enter a date manually in the Historical Start Date field, i.e. 03/19/2019, or
- Click on the calendar icon to pop-up a calendar to use to make a date selection.
4. The Weekly Activity page refreshes, and now displays the weekly graphs as they appeared three weeks ago.
NOTE: In the filter parameters, you may find Week to View as in the example used here, or you may see Periods, or other time-frame designations used. Inspire is completely configurable by your Inspire Administrator and Week to View is used here for illustrative purposes.
Remember, the longer Inspire is used, the more historical data you will have available, and the easier it will be to spot trends.
Export the Report
1. Click the Export ![]() icon. The drop down list will appear.
icon. The drop down list will appear.
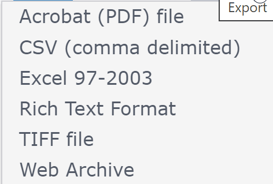
2. Click on the preferred export type. The file will be available to you in your downloads folder.
Useful Tips
-
- You can use the parameter panel toggle to minimize or expand the filter parameters panel when viewing the report.
-
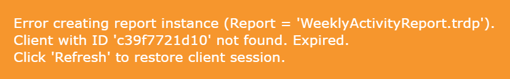
- The message below, or a similar message, may appear when using filter parameters, when printing, or when exporting the report. The message appears because the report uses active, current, data and the report has been idle too long, has timed out, and needs to be refreshed.
- Click Refresh
 on the report toolbar to update the report with the new parameters and resolve the error message.
- Click Refresh
- The message below, or a similar message, may appear when using filter parameters, when printing, or when exporting the report. The message appears because the report uses active, current, data and the report has been idle too long, has timed out, and needs to be refreshed.